








TL;DR
- JSM provides valuable operational data, but operational metrics do not always show the full employee experience.
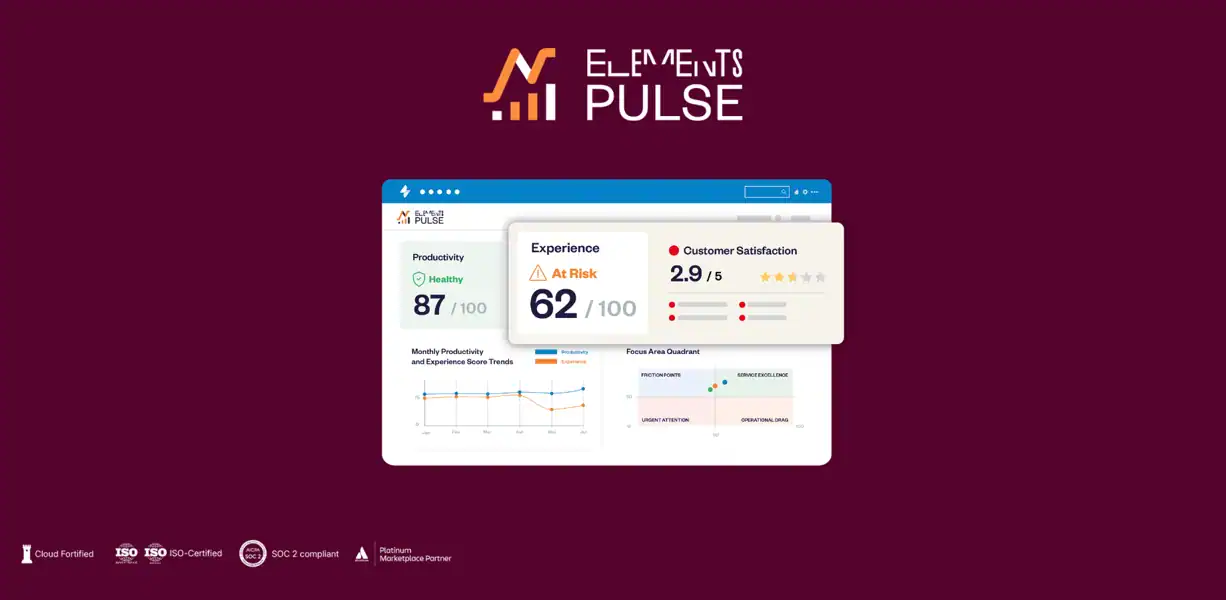
- Elements Pulse combines JSM service data with experience signals such as CSAT, NPS and CES.
- Flexible surveys, dashboards and correlation graphs help identify where digital friction is concentrated.
- IT leaders can drill down into services, request types, organizations and other areas to understand what needs attention.
- Elements Pulse is designed to help IT leaders prioritize investments, justify budgets and communicate the business impact of IT.
There is a familiar moment in IT leadership.
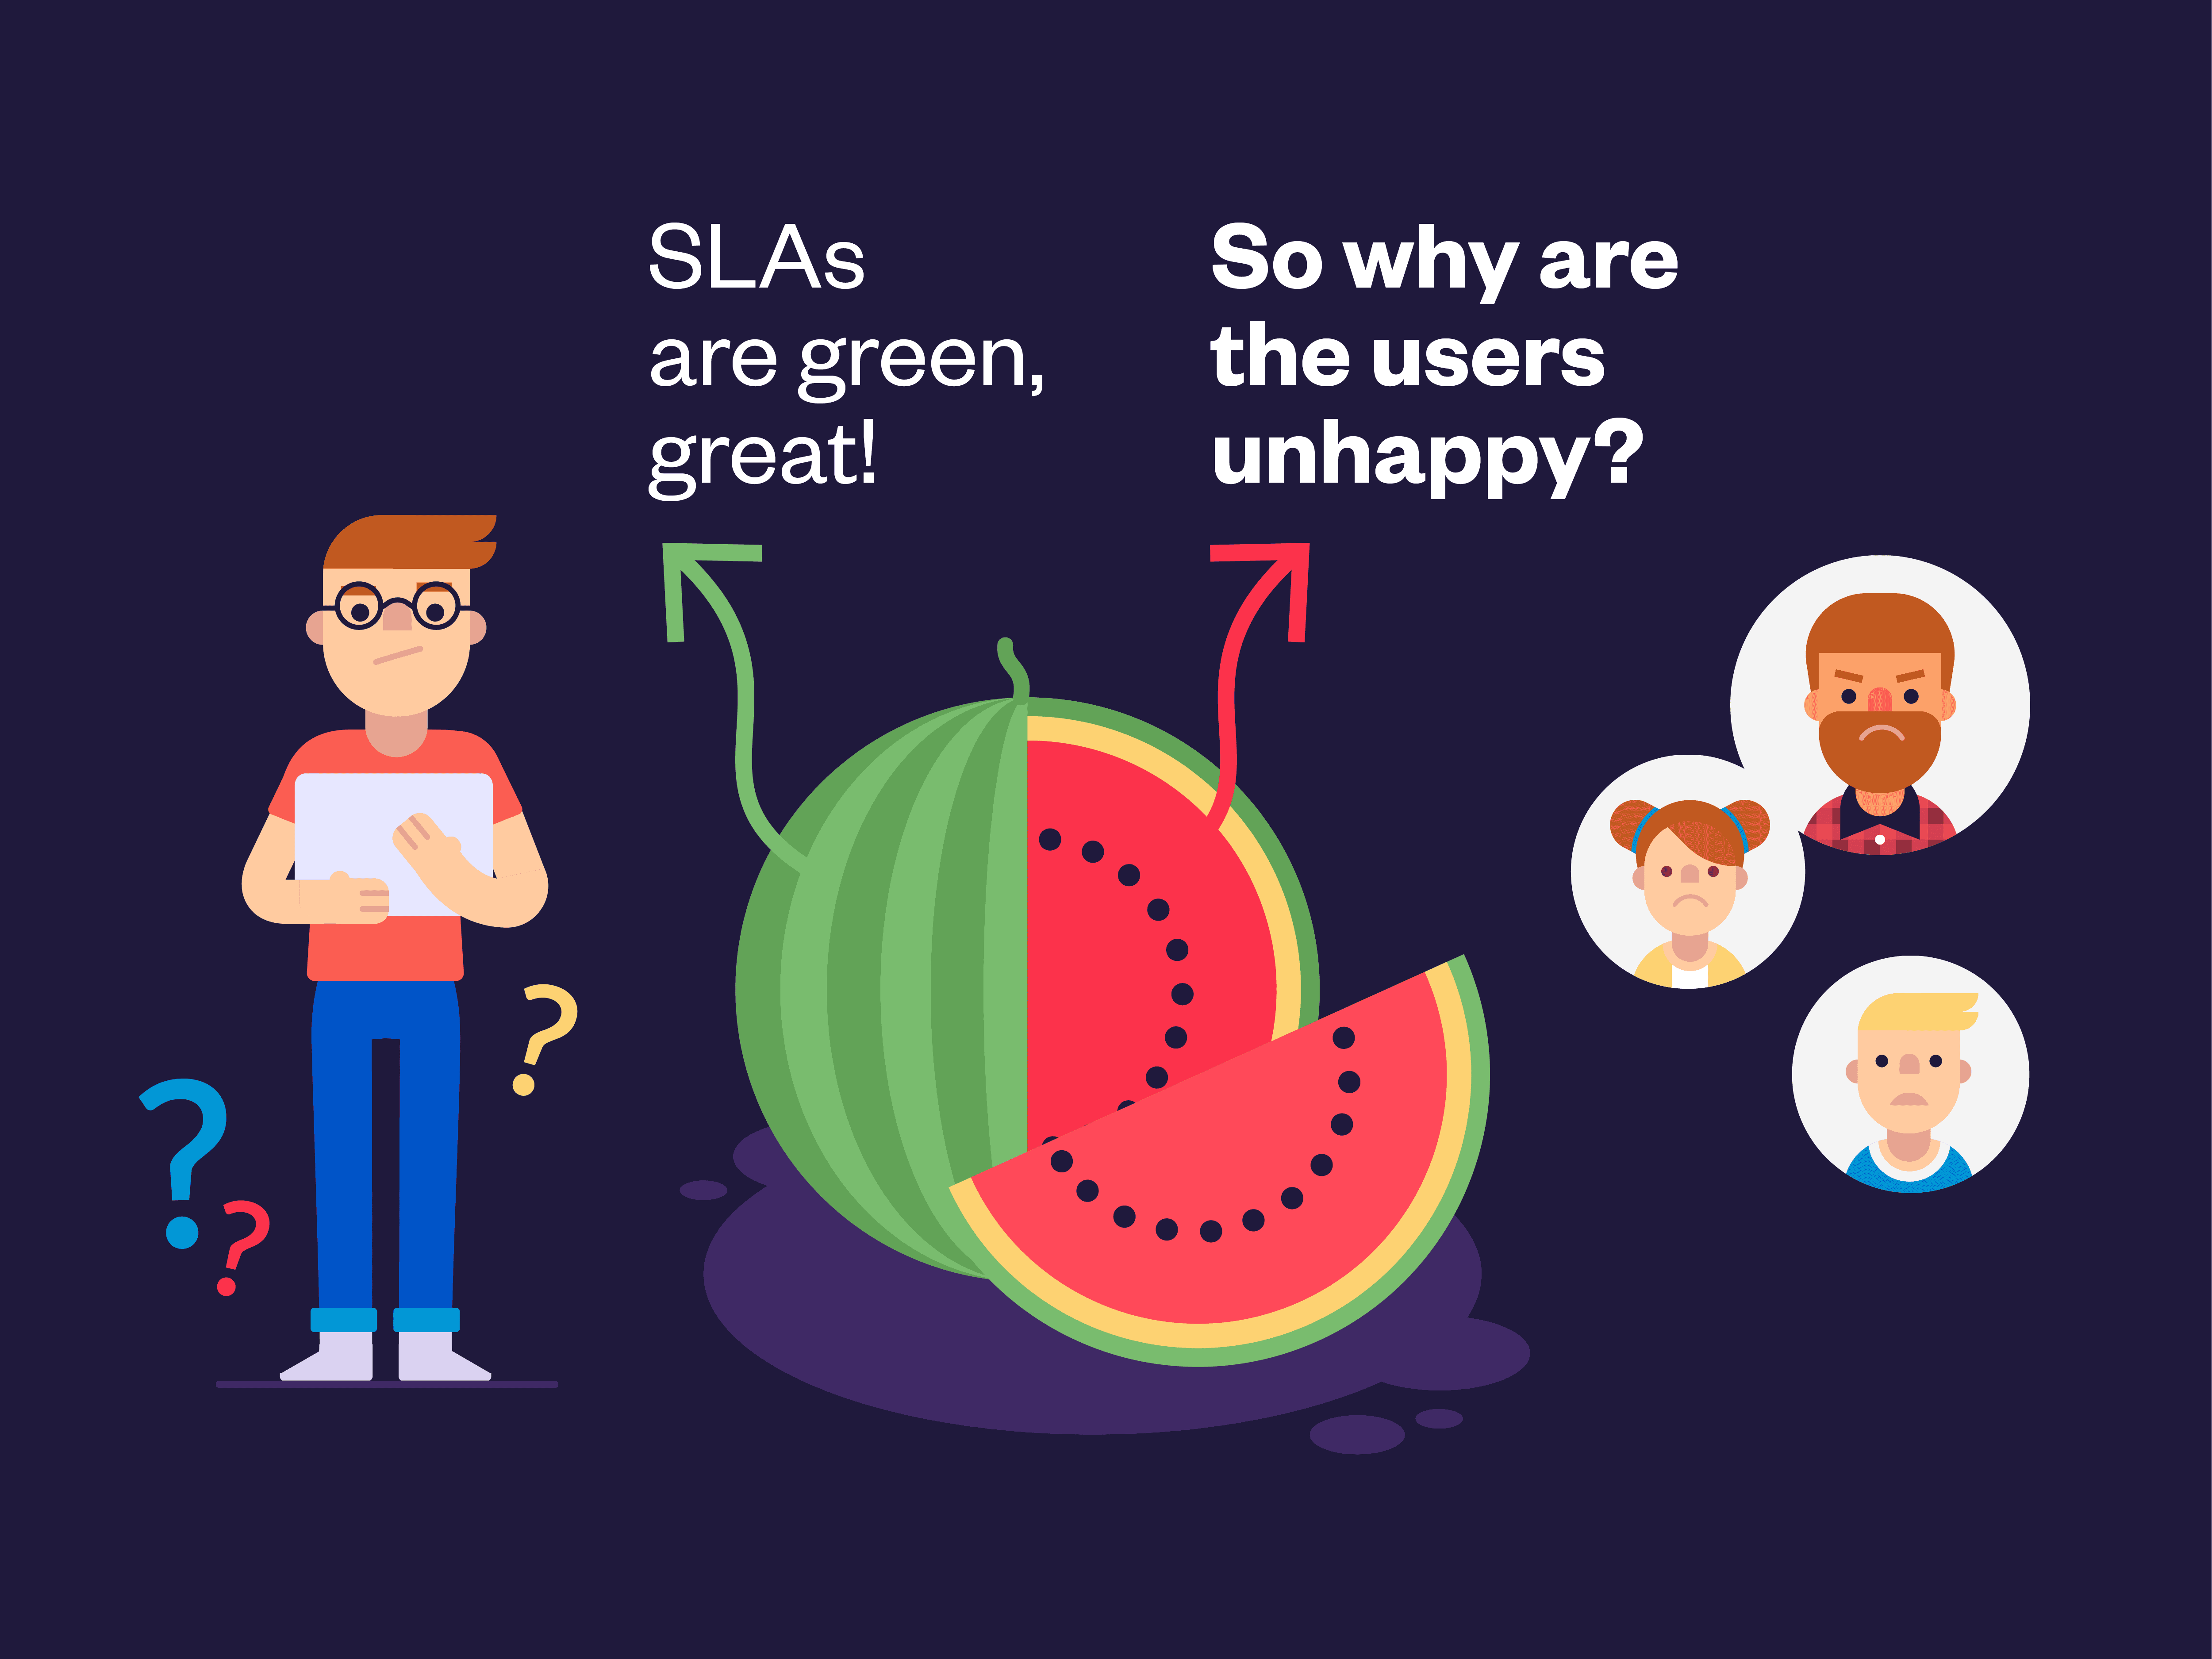
The monthly service report looks good. SLAs are green. Resolution times are within target.
Then someone asks:
“Why are employees still frustrated with IT?”
It is a fair question.
Traditional ITSM reporting is good at telling you what happened. How many requests came in. How quickly they were resolved. Which SLAs were met.
But these numbers do not always tell you how people actually experience those services.
Employees do not experience an SLA. They experience whether they can get their work done without friction.
This is the gap Elements Pulse is designed to address.
Built on top of Jira Service Management, Elements Pulse combines operational IT data with real employee experience signals. It helps IT leaders understand not only what is happening, but why it matters and where they should act first.
The problem with looking only at ITSM metrics
Jira Service Management gives IT teams a strong operational foundation.
You can track ticket volumes, response times, resolution times, SLA performance and other service metrics. That information is essential for running an effective service desk.
But there is a difference between service performance and service experience.
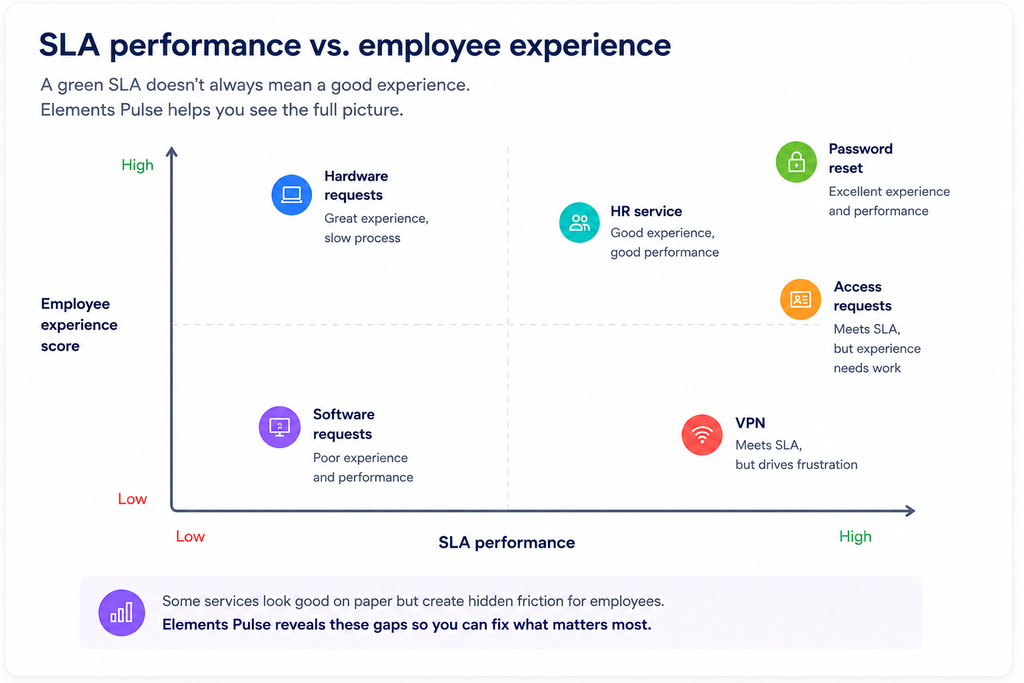
Imagine your VPN service has a 98% SLA compliance rate.
That sounds great.
But what if employees have to reconnect several times a day? What if the process technically works but is frustrating to use? What if people spend several minutes trying to find the right request type before they can contact IT?
The SLA can still be green.
The employee experience is not.
This is one of the limitations of traditional Jira Service Management reporting. It shows what is happening inside the service process, but not necessarily what is happening from the employee’s perspective.
From service metrics to employee experience
Employee experience measurement is not about replacing operational data.
It is about adding another layer to it.
Think about two sources of information.
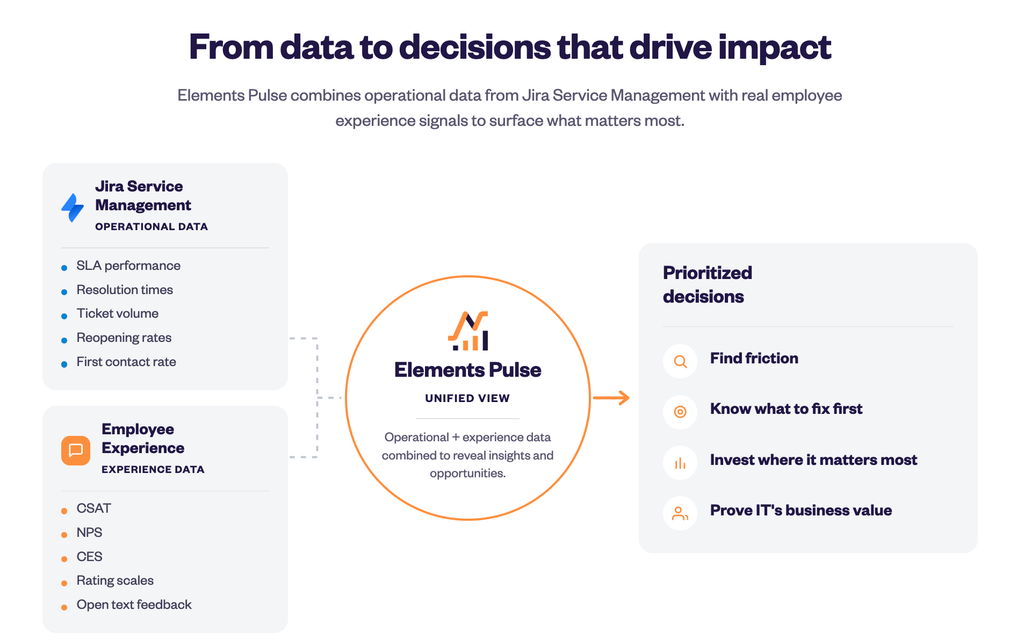
Operational data:
- Ticket volumes
- Resolution times
- SLA performance
- First contact rates
- Reopening rates
Experience data:
- CSAT
- NPS
- CES
- Rating scales
- Open-text feedback
On their own, each tells only part of the story.
Together, they can reveal something much more useful.
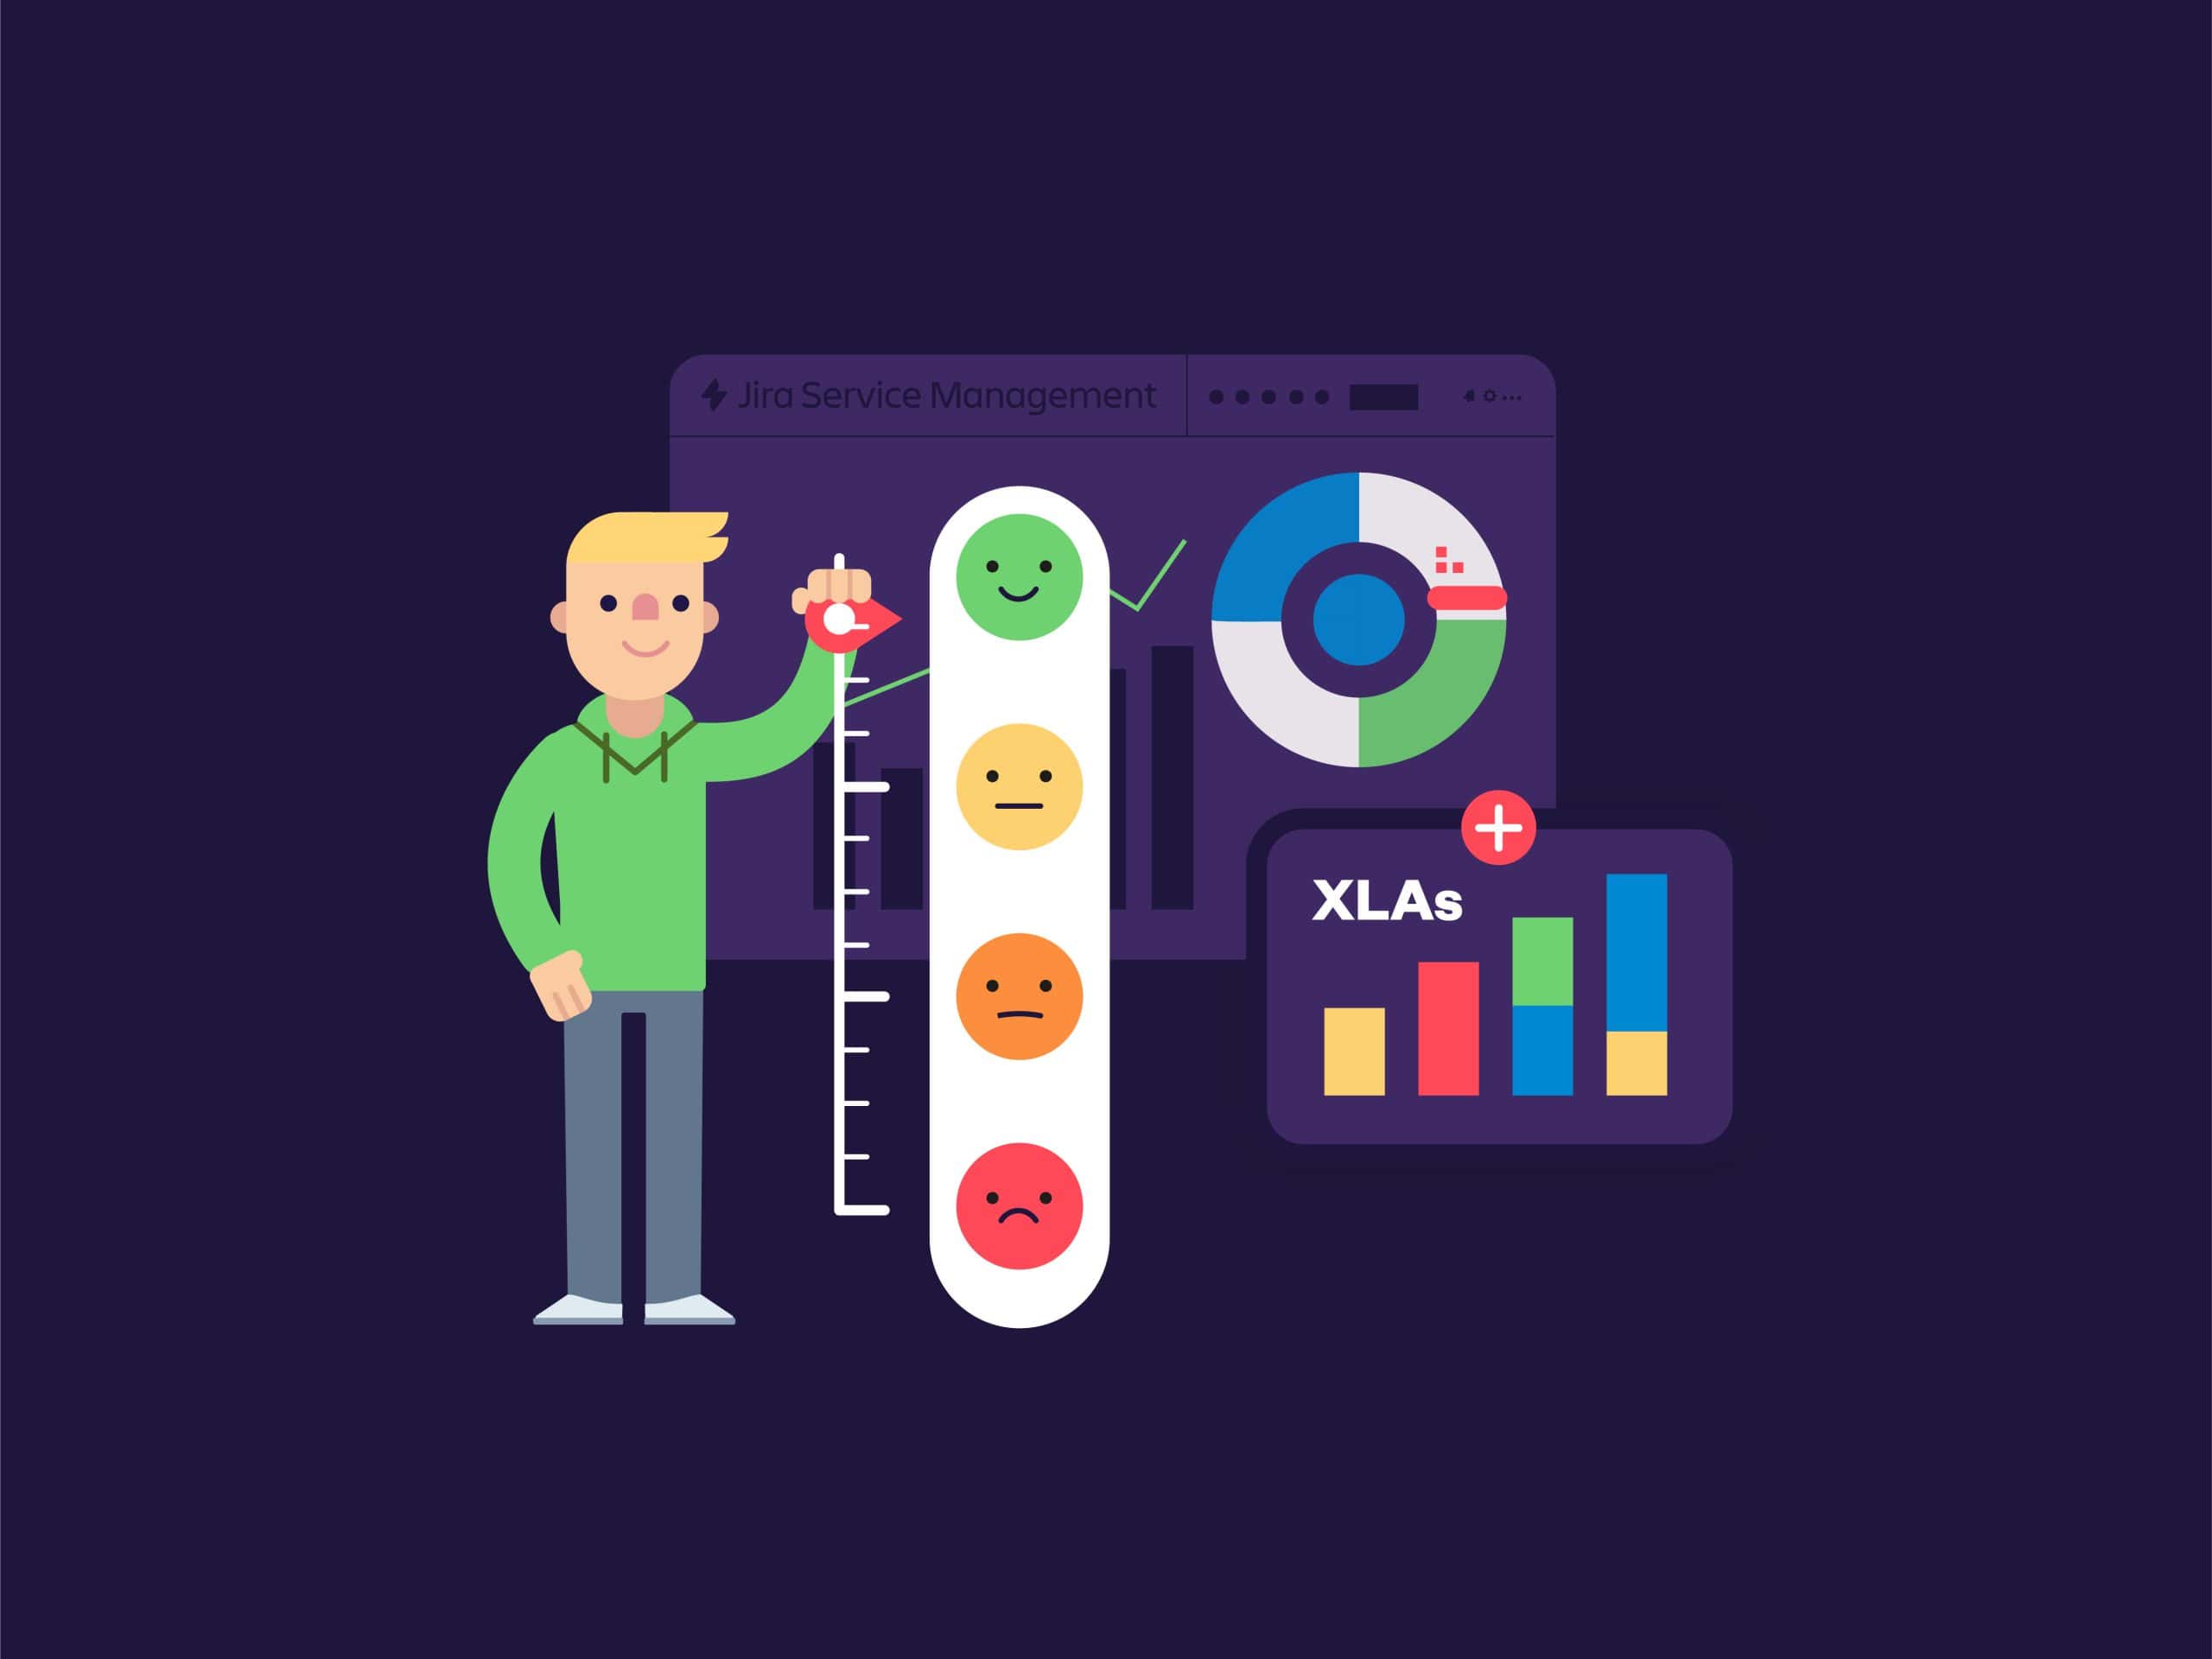
For example, a service might have excellent resolution times but consistently low employee satisfaction. That tells you something important: the service may be efficient from an IT perspective while still creating friction for the people using it.
Elements Pulse connects these two sides so IT leaders can see the gap instead of relying on one metric.
What is IT experience management?
IT Experience Management, or ITXM, focuses on how employees experience the technology and IT services they use every day.
It asks questions that traditional ITSM reporting does not always answer:
- Where are employees experiencing the most digital friction?
- Which IT services create the most frustration?
- Which teams are most affected?
- Which problems could have the biggest impact on productivity?
- Where should IT invest next?
This is what makes Jira experience management different from simply adding another dashboard to Jira.
The objective is not to collect more numbers.
It is to turn those numbers into decisions.
How Elements Pulse changes the conversation
Elements Pulse brings operational data from Jira Service Management together with employee experience signals in a unified view.
It then adds tools to help leaders understand the relationship between the two.
For example, correlation graphs can help reveal connections between service performance and experience scores. Dashboards provide an overall view, while drill-downs allow teams to explore specific spaces, request types or organizations.
There are also flexible, multi-question surveys with CSAT, NPS, CES, rating scales, open text and conditional logic.
This matters because a single satisfaction question rarely tells the whole story.
You might learn that an employee is unhappy with a service. A follow-up question can help uncover why.
And surveys do not have to rely entirely on employees remembering to complete them. Survey links can be embedded into request comments or triggered through JSM automation rules, making feedback more contextual and easier to collect.
From reporting to prioritization
One of the biggest challenges for IT leaders is deciding what deserves attention first.
There are always more improvements to make than there is time or budget to make them.
A service might have poor satisfaction.
Another might affect far more employees.
A third might have relatively few tickets but create significant friction for an important group.
Looking at one metric at a time makes these decisions difficult.
Elements Pulse is designed to bring the signals together.
Its dashboards, correlation views and drill-downs help surface where friction is concentrated and what deserves attention.
The process becomes much more practical:
Measure → identify friction → understand impact → prioritize → act → measure again
That last step matters.
Employee experience management should not be a one-time survey exercise. If you improve a service, you should be able to understand whether the experience improved afterwards.
How do you measure employee experience?
There is no single answer to how to measure employee experience.
For IT teams, a useful approach is to combine operational service data with direct employee feedback.
That is where tools such as a Jira survey can help.
Instead of relying only on a basic Jira customer satisfaction survey, teams can use multi-question surveys to collect richer feedback. CSAT, NPS, CES, rating scales and open-text responses can each provide a different perspective.
But collecting responses is only the beginning.
The real value comes from connecting those responses with what is happening operationally.
If employees report that a service is difficult to use, IT can look at the service data alongside that feedback and investigate the possible causes.
That makes employee experience management in Jira more actionable.
Beyond dashboards: giving IT a story to tell
IT leaders are often surrounded by data.
The problem is that data alone is not a narrative, and a narrative is what leadership needs to make a decision.
This is particularly important when IT needs to defend an investment.
Instead of presenting executives with another spreadsheet of ticket volumes and SLA percentages, IT can show where employee friction exists, which services are affected and why a particular improvement deserves attention.
That changes the conversation from:
“Here is what IT did this month.”
to:
“Here is where employees are experiencing friction, what it means for productivity, and where we should invest next.”
That is a much stronger way to communicate IT value.
Not another BI dashboard
There is no shortage of BI and analytics tools. There is also no shortage of survey platforms.
The challenge is that IT leaders often have to connect these systems themselves.
They may export JSM data into Excel, collect employee feedback somewhere else, build dashboards in another platform and then manually try to connect the dots.
Elements Pulse is built specifically around the IT experience.
It brings operational and experience data together within the Atlassian environment, reducing the need for manual exports and disconnected reporting workflows.
And rather than expecting every IT leader to be a data analyst, Elements Pulse is designed to surface clear, prioritized insights.
Why this matters for IT leaders
IT has spent years getting better at proving that services are operationally healthy.
The next challenge is proving that they are valuable.
That means moving beyond:
“Did we meet our SLA?”
and asking:
“Did this service help employees work better?”
For CIOs and Heads of IT, that means having stronger evidence when defending IT costs and requesting investment.
For service management leaders, it means knowing what to fix first.
And for the wider business, it means seeing IT not simply as a cost center, but as something that directly affects employee productivity.
That is ultimately what Elements Pulse is designed to help achieve.
Operational data tells you what is happening.
Employee experience tells you how it feels.
Together, they provide a better basis for deciding what to do next.
For organizations using Jira Service Management, it offers a new way to think about what their IT data can actually tell them.
Not just whether services are running.
But whether they are working well for the people who depend on them.
Frequently asked questions
What is Elements Pulse?
Elements Pulse is an IT Experience Management app built on top of Jira Service Management. It combines operational IT data with employee experience signals to help IT leaders identify digital friction, prioritize improvements and prove the value of IT services.
What is IT experience management?
IT experience management focuses on how employees experience the IT services and technology they use. It combines service performance information with employee feedback to understand where friction exists and what should be improved.
How is Elements Pulse different from Jira Service Management reporting?
Jira Service Management reporting focuses primarily on operational service data. Elements Pulse adds employee experience signals such as CSAT, NPS and CES, helping IT leaders understand the human impact behind those metrics.
How do you measure employee experience in IT?
A useful approach is to combine operational data with direct employee feedback. Looking at satisfaction, effort, feedback and service performance together provides a more complete picture than relying on any single metric.
Can I create surveys in Jira Service Management using Elements Pulse?
Elements Pulse supports flexible multi-question surveys with CSAT, NPS, CES, rating scales, open text and conditional logic. Surveys can also be triggered through JSM automation rules or embedded in request comments.
Is Elements Pulse a BI or reporting tool?
Not exactly. Elements Pulse is designed as an IT Experience Management and decision-support solution. Its purpose is to connect service data and employee experience so IT leaders can identify priorities, justify decisions and communicate IT’s business impact.
About the author
Anahit Sukiasyan is an Atlassian Community Champion in Yerevan, Armenia, recognized for her dedication to fostering collaboration, innovation, and knowledge-sharing within the global Atlassian ecosystem.
With a strong background in IT Service Management, she has extensive hands-on experience with Jira, Jira Service Management, Confluence, Trello, and Jira Product Discovery, working across both Cloud and Data Center environments. Anahit specializes in end-to-end Jira project configuration, tailoring workflows, automation, and reporting to align with diverse business needs and improve operational efficiency.